Wednesday, January 28, 2009

BAC Bank of America StockJanuary-28 2009


7.6612 Change:
+1.1612 Open:
7.64 High:
7.81 Low:
7.22 Volume:
144,449,973
Percent Change:
+17.86% Yield:
0.52% P/E Ratio:
13.93 52 Week Range:
5.05 to 45.08

Friday, January 23, 2009

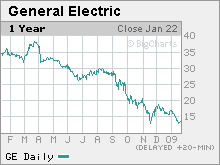
GE Stock Slumps January-23 2009


GE earnings dim by 47%
Last 12.03 Quote Time 01/23/2009 22:37 ET

Change -1.45 % Change -10.76%

Open 12.69 Prev. Close 13.48

High 13.19 Low 11.87

Volume 326.45 m Market Cap 126.58 b

52 Wk High 38.52 52 Wk Low 11.87

Shares 10.52 b Market NYE


http://money.cnn.com/2009/01/23/news/companies/general_electric/index.htm?postversion=2009012310
http://www.ge.com/investors/stock_info/index.html

Sunday, January 11, 2009

Stock AEGON January-09 2009


AEGON
Last (€) 5.267
http://www.euronext.com/trader/summarizedmarket/stocks-2593-EN-NL0000303709.html?selectedMep=2

Stock Wal Mart January-09 2009


WAL MART STORES INC COM WMT: NYSE

Saturday, January 10, 2009

Thursday, January 8, 2009

Stocks Selected Steel Jnuary-08 2009

Symbol Last Trade Change Volume Prev Cls Open Day's Range Intraday
STLD 13.57 Up 0.79 Up 6.18% 7,037,678 12.78 12.58 12.21 - 13.60
GNA 6.87 Up 0.53 Up 8.36% 993,711 6.34 6.28 6.19 - 6.88
AKS 13.00 Up 1.28 Up 10.92% 15,463,262 11.72 12.08 11.76 - 13.07

Wednesday, January 7, 2009

DOW 5-Months Chart Jan-07-09


http://stockcharts.com/charts/gallery.html?$INDU

Stocks Home Builder Sector January 2009 Earning Estimates

DHI Standard and Poor

Lennar ***
HOV ***
CTX ***
LEN LENNAR

HOVNANIAN ENTERPRISES INC CL A HOV: NYSE

CENTEX CORP COM CTX: NYSE

D R HORTON INC COM DHI: NYSE

Lennar

Hovanian

CTX CENTEX

DHI DR HORTON

DRYS Dryships vs. Dow Jan06-09

Tuesday, January 6, 2009

Financial Stocks January-06 09

Symbol Last Today’s Change Bid Size Ask Size Volume More
MS 19.58 +1.96 (+11.12%) 38,951,702
PRU 35.11 +4.54 (+14.85%) 11,744,288
LNC 25.01 +3.20 (+14.67%) 7,006,239
GNW 3.17 +0.34 (+12.01%) 21,573,819
HIG 19.68 +2.45 (+14.22%) 17,602,815
ACAS 7.31 +2.11 (+40.58%) 18,001,993
ALD 4.80 +1.25 (+35.21%) 8,811,982
GGP 1.60 +0.25 (+18.52%) 14,221,364
HOV 2.19 +0.31 (+16.49%) 7,153,504
PLD 16.20 +1.99 (+14.00%) 25,689,964

Metal Stocks Jan-06-09

RTP Rio Tinto PlcRTP (NYSE) 117.20Change:+15.65+15.41%Volume:2.93M

Stocks Biggest Percentage Gainers January-06 2009

NYSE as of 04:15 PM on 01/06/2009
Symbol Company Name Change %Change Last Volume
MPG MAGUIRE PPTYS INC +0.86 +58.90 2.32 2.33 M
ARM ARVINMERITOR INC +1.28 +47.94 3.95 4.82 M
GLG.U GLG PARTNERS INC +0.91 +39.22 3.23 1,000
BEE STRATEGIC HOTELS & RESORTS I +0.58 +38.67 2.08 2.5 M
GLG GLG PARTNERS INC +0.90 +37.50 3.30 813,563
DDR DEVELOPERS DIVERSIFIED RLTY +2.05 +35.96 7.75 12.8 M
ALD ALLIED CAP CORP NEW +1.25 +35.21 4.80 8.81 M
AHD ATLAS PIPELINE HOLDINGS LP +1.80 +34.68 6.99 1.2 M
DFT DUPONT FABROS TECHNOLOGY INC +0.93 +33.82 3.68 1.54 M

NASDAQ as of 04:08 PM on 01/06/2009

RVEP RIO VISTA ENERGY PARTNERS L +1.22 +114.02 2.29 182,349
IDEV INDEVUS PHARMACEUTICALS INC +2.28 +73.55 5.38 25.28 M
HAST HASTINGS ENTMT INC +1.28 +69.57 3.12 59,591
TXCO TXCO RES INC +1.15 +61.50 3.02 3.45 M
HABC HABERSHAM BANCORP INC +1.61 +60.53 4.27 11,891
WLDN WILLDAN GROUP INC +1.00 +50.25 2.99 59,485
XTXI CROSSTEX ENERGY INC +2.18 +48.12 6.71 2.63 M
CSCD CASCADE MICROTECH INC +0.96 +41.03 3.30 16,844

AMEX as of 04:06 PM on 01/06/2009

PLG PLATINUM GROUP METALS LTD +0.46 +25.70 2.25 396,792
CCF CHASE CORP +2.94 +25.57 14.44 40,670
NOG NORTHERN OIL & GAS INC NEV +0.69 +24.73 3.48 1.02 M
NG NOVAGOLD RES INC +0.42 +23.33 2.22 5.35 M
MEA METALICO INC +0.57 +21.03 3.28 1.61 M
APP AMERICAN APPAREL INC +0.42 +20.90 2.43 1.82 M
LGN LODGIAN INC +0.51 +20.65 2.98 48,705
LKI LAZARE KAPLAN INTL INC +0.82 +18.81 5.18 1,400
GOK GEOKINETICS INC +0.51 +18.28 3.30 161,546
RIV RIVIERA HLDGS CORP +0.74 +18.27 4.79 44,941

http://finance.aol.com/usw/quotes/mostactives?exchange=0&type=3

BBY 6-Months Chart Dec-06 2009


http://www.bloggingstocks.com/2009/01/06/bed-bath-and-beyond-bbby-q3-earnings-preview/

Stocks January-06 09


TXCO $1.87 $2.06 10.16% 10,85


$5.20 $5.86 12.69% 55,610

http://dynamic.nasdaq.com/dynamic/premarketma.stm

Advertisers

Please encourage the Advertisers.

The Stock Market January-06 2009


Oil above $48 as Gaza conflict keeps tensions high, investors hope OPEC to implement cuts
05 35 am
Goldman Sachs (NYSE:GS - News) upgraded electronics retail giant, Best Buy (NYSE:BBY - News) to "buy" on Tuesday. GS and BBY both has a Short Term PowerRating of 2

Verizon Communications (NYSE:VZ - News) and AT&T (NYSE:T - News) - were downgraded by a Bernstein analyst.

Dow Current
8,952.89

http://www.businessweek.com/

Stocks Expectations January-06 2009

Amedisys, Cigna, Dow Chemical, Indevus, LDK Sollar, Wells Fargo

8:01 a.m. EST Jan. 6, 2009

Amedisys Inc. (AMED:

AMED 40.33, -0.39, -1.0%) on Tuesday unveiled its financial targets for fiscal 2009. The Nursing-services company expects revenue to range $1.425 billion to $1.475 billion, excluding the effect of potential acquisitions, and earnings per share between $4.10 and $4.30, based on an estimated 27.5 million shares outstanding.

AMR Corp.: (AMR:

AMR 11.22, +0.08, +0.7%) Traffic at American Airlines fell 8.2% to 10.32 billion revenue passenger miles in December from 11.24 billion in the year-earlier month.
%.
Cigna Corp. CI:

Last: 18.15+0.36+2.02%

CAL 19.55, +0.41, +2.1%)

Dow Chemical Co. (DOW:
Last: 15.05-0.36-2.34%

DOW 15.05, -0.36, -2.3%)

GGP 1.35, -0.07, -4.9%) the Chicago real estate investment trust, said on Tuesday that it settled a lawsuit relating to a California mall held by a 50%-owned joint venture for $48 million.

Google Inc. (GOOG:
Last: 328.05+6.73+2.09%
GOOG 328.05, +6.73, +2.1%) continued to take a larger share of the U.S. Internet-search market in November, according to Nielsen Online. Google's share of the market rose 21.7% compared to the period a year earlier to 64.1% in November,

IDEV 3.10, -0.05, -1.6%) Endo Pharmaceuticals Holdings Inc. (ENDP:

Macrovision Solutions: (MVSN: Last: 12.95-0.38-2.85%

Mosaic Co. MOS: Last: 37.67+37.670.00%
MOS 37.67, +37.67, 0.0%) fiscal second-quarter net income rose to $959.8 million, or $2.15 a share, from $394 million, or 89 cents a share, .

Wells Fargo & Co. WFC: Wells Fargo Last: 28.06-1.94-6.47


http://www.marketwatch.com/news/story/tuesdays-biggest-gaining-declining-stocks/story.aspx?guid={4F164D9D-753E-4741-94A1-D4D2C7116C89}&tool=1&dist=bigcharts&orig=charting&time=8&symb=IDEV&sid=1100643&source=htx\http2_mw

Monday, January 5, 2009

MEA Metali Jan-05-09


MEA Metalico Inc (NYSE-Alt) 1/5/2009

Last: 2.71 Change: +0.72 Open: 2.08 High: 2.79 Low: 2.03 Volume: 1,296,400
Percent Change: +36.18%
P/E Ratio: 3.47
52 Week Range: 1.15 to 18.85

Zacks Picks Jan-05 2009

Today's Value Stock
Syngenta AG (SYT)
Syngenta projects 2009 growth in the high teens as agribusiness stays strong. Stock Chart: SYT

* Momentum: Huron Consulting, Inc. (HURN)
* Aggressive Growth: Express Scripts, Inc. (ESRX)
* Growth & Income: DeVry, Inc. (DV)
* Zacks #1 Rank Additions for: Dec 30, 2008

Zacks Video Zacks Rank Video: Zacks Rank Value Buys

Dow-Chart 5-Days January-05 12009

Sunday, January 4, 2009

Dry Ships DRYS Chart 3-Months


QUOTE.COM JAN-05-09

January-2 2009
DRYSHIPS INC (NASD)
DRYS 12.49 1.83 (17.17%) Vol. 24,544,871
Day Low - High 11.59 - 12.77
52wk Low - High 3.04 - 116.43
Avg Volume 23,176,152
Industry TRANS-SHIP
Market Cap 543.81 M
Div - Yield 0.80 - 6.41
PE (forward) 2.46
PEG Ratio N/A
Current Year Est. 4.82
EPS Last Year 15.77

Dow Performance Since September 2008 to January-2 2009

The Dow Jones industrials' moves since Lehman fall
How the Dow Jones industrials have fared each trading day since fall of Lehman Brothers

* The Associated Press
* Friday January 2, 2009, 6:29 pm EST

How far the Dow Jones industrial average has fallen or advanced each trading day since Lehman Brothers Holdings Inc. filed for Chapter 11 bankruptcy protection on Sept. 15. After Lehman's fall, the credit markets seized up, generally sending stocks plunging and eventually leading to the creation of the government's financial rescue plan. The numbers are the closing levels for the Dow:

-- Sept. 15, down 504.48 at 10,917.51.

-- Sept. 16, up 141.51 at 11,059.02.

-- Sept. 17, down 449.36 at 10,609.66.

-- Sept. 18, up 410.03 at 11,019.69.

-- Sept. 19, up 368.75 at 11,388.44.

-- Sept. 22, down 372.75 at 11,015.89.

-- Sept. 23, down 161.52 at 10,854.17.

-- Sept. 24, down 29 at 10,825.17.

-- Sept. 25, up 196.89 at 11, 022.06.

-- Sept. 26, up 121.07 at 11,143.13.

-- Sept. 29, down 777.68 at 10,365.45.

-- Sept. 30, up 485.21 at 10,850.66.

-- Oct. 1, down 19.59 at 10,831.07.

-- Oct. 2, down 348.23 at 10,482.84.

-- Oct. 3, down 157.46 at 10,325.38.

-- Oct. 6, down 369.88 at 9,955.50.

-- Oct. 7, down 508.39 at 9,447.11.

-- Oct. 8, down 189.01 at 9,258.10.

-- Oct. 9, down 678.91 at 8,579.19.

-- Oct. 10, down 128 at 8,451.19.

-- Oct. 13, up 936.42 at 9,387.61.

-- Oct. 14, down 76.62 at 9,310.99.

-- Oct. 15, down 733.08 at 8,577.91.

-- Oct. 16, up 401.35 at 8,979.26.

-- Oct. 17, down 127.04 at 8,852.22.

-- Oct. 20, up 413.21 at 9,265.43.

-- Oct. 21, down 231.77 at 9,033.66.

-- Oct. 22, down 514.45 at 8,519.21.

-- Oct. 23, up 172.04 at 8,691.25.

-- Oct. 24, down 312.30 at 8,378.95.

-- Oct. 27, down 203.18 at 8,175.77.

-- Oct. 28, up 889.35 at 9,065.12.

-- Oct. 29, down 74.16 at 8,990.96.

-- Oct. 30, up 189.73 at 9,180.69.

-- Oct. 31, up 144.32 at 9,325.01.

-- Nov. 3, down 5.18 at 9,319.83.

-- Nov. 4, up 305.45 at 9,625.28.

-- Nov. 5, down 486.01 at 9,139.27.

-- Nov. 6, down 443.48 at 8,695.79.

-- Nov. 7, up 248.02 at 8,943.81.

-- Nov. 10, down 73.27 at 8,870.54.

-- Nov. 11, down 176.58 at 8,693.96.

-- Nov. 12, down 411.30 at 8,282.66.

-- Nov. 13, up 552.59 at 8,835.25.

-- Nov. 14, down 337.93 at 8,497.31.

-- Nov. 17, down 223.73 at 8,273.58.

-- Nov. 18, up 151.17 at 8,424.75.

-- Nov. 19, down 427.47 at 7,997.28.

-- Nov. 20, down 444.99 at 7,552.29.

-- Nov. 21, up 494.13 at 8,046.42.

-- Nov. 24, up 396.97 at 8,443.39.

-- Nov. 25, up 36.08 at 8,479.47.

-- Nov. 26, up 247.14 at 8,726.61.

-- Nov. 28, up 102.43 at 8,829.04.

-- Dec. 1, down 679.95 at 8,149.09.

-- Dec. 2, up 270.00 at 8,419.09.

-- Dec. 3, up 172.60 at 8,591.69.

-- Dec. 4, down 215.45 at 8,376.24.

-- Dec. 5, up 259.18 at 8,635.42.

--Dec. 8, up 298.76 at 8,934.18.

--Dec. 9, down 242.85 at 8,691.33.

--Dec. 10, up 70.09 at 8,761.42.

--Dec. 11, down 196.33 at 8,565.09.

--Dec. 12, up 64.59 at 8,629.68.

--Dec. 15, down 65.15 at 8,564.53.

--Dec. 16, up 359.61 at 8,924.14.

--Dec. 17, down 99.80 at 8,824.34.

--Dec. 18, down 219.35 at 8,604.99.

--Dec. 19, down 25.88 at 8,579.11.

--Dec. 22, down 59.34 at 8,519.77.

--Dec. 23, down 100.28 at 8,419.49.

--Dec. 24, up 48.99 at 8,468.48.

--Dec. 26, up 47.07 at 8,515.55.

--Dec. 29, down 31.62 at 8,483.93.

--Dec. 30, up 184.46 at 8,668.39.

--Dec. 31, up 108.00 at 8,776.39.

--Jan. 2, up 258.30 at 9,034.69.

Net loss since Sept. 15: 1,882.82

http://finance.yahoo.com/news/The-Dow-Jones-industrials-apf-13956240.html

Saturday, January 3, 2009

One Dollar Mortgage Related Stoks January 2009

ETFC

Super Performing Stocks January2- 2009

FWLt Foster Wheeler

MDR McDermott

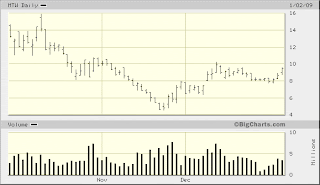
MTW Mantowok

SGR Shaw Group

Name Symbol Price % Price Change Today Average Volume
SHAW GROUP INC SGR 22.00 11.00 3.067 M
MOODYS CORP MCO 22.00 10.00 3.304 M
GARMIN LTD GRMN 21.00 13.00 1.537 M
NII HLDGS INC NIHD 21.00 16.00 2.372 M
STARWOOD HOTELS&RESORTS WRLD HOT 20.00 16.00 4.26 M
WALTER INDS INC WLT 20.00 16.00 2.514 M
GENERAL CABLE CORP DEL NEW BGC 20.00 13.00 1.751 M
CAMECO CORP CCJ 19.00 12.00 2.901 M
ALPHA NATURAL RESOURCES INC ANR 18.00 13.00 3.313 M
FOREST OIL CORP FST 18.00 10.00 2.231 M
AEROPOSTALE ARO 18.00 12.00 2.712 M
PIONEER NAT RES CO PXD 18.00 11.00 2.618 M
PRIDE INTL INC DEL PDE 17.00 10.00 3.055 M
ATWOOD OCEANICS INC ATW 17.00 14.00 1.30 M
JAMES RIVER COAL CO JRCC 17.00 12.00 1.866 M
GENCO SHIPPING & TRADING LTD GNK 17.00 14.00 2.569 M
FOUNDATION COAL HLDGS INC FCL 16.00 16.00 1.541 M
MASSEY ENERGY CORP MEE 16.00 17.00 4.082 M
ALUMINUM CORP CHINA LTD ACH 15.00 15.00 1.425 M
MGM MIRAGE MGM 15.00 12.00 3.349 M

Obama domestic programs that will be designed to create jobs and rebuild decaying infrastructure. In addition power generation will be another focus for the federal government. Some stocks that could get a boost from such capital spending programs are Aecom Technology (ACM Quote - Cramer on ACM - Stock Picks), Fluor (FLR Quote - Cramer on FLR - Stock Picks), McDermott (MDR Quote - Cramer on MDR - Stock Picks), Foster Wheeler (FWLT Quote - Cramer on FWLT - Stock Picks), Manitowoc (MTW Quote - Cramer on MTW - Stock Picks), Shaw Group (SGR Quote - Cramer on SGR - Stock Picks), Jacobs Engineering (JEC Quote - Cramer on JEC - Stock Picks), KBR (KBR Quote - Cramer on KBR - Stock Picks) and Chicago Bridge & Iron (CBI Quote - Cramer on CBI - Stock Picks).

http://www.thestreet.com/story/10455829/3/four-investing-tips-for-2009.html

Thursday, January 1, 2009

2008 Fallen Stars Stocks

MDR

Iron and Steel December-31-2008


PKX +.8%

PRX

AKS +3.7%

WOR +3%

CMC +3%

MT +1.4%

SCHN +1.5%

X -1%

NUE +25%

TX= +5.7%

GNA +2.7%

MTL +1%

STLD +1.6%